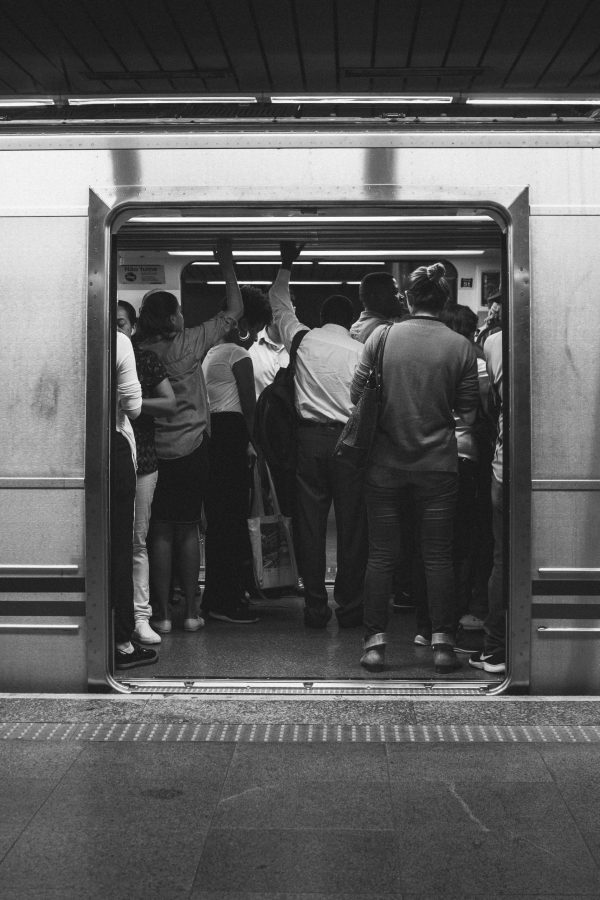
The Social Distancing Index™
Is this a calculation that can be made for people and get alerts on their phones?
Could there be a series of calculations to determine density of passengers on platforms and platform areas. Can that data combine with crowd sourced information and using multiple data sets and some assumptions and inferences.
| Trains | Seats | Turnstile entry | T-Stile exit | Platform Density |
| N | % of Full | # | # | Scale/Map |
https://www.kaggle.com/nieyuqi/mta-turnstile-data-analysis
There is data here.
https://www.safegraph.com/dashboard/covid19-commerce-patterns
Here is an example of the dashboards and patterns already out there to use.
https://www.hindawi.com/journals/jat/2017/4073583/
This is an example. While old can be meaningful as a starting point.
https://en.wikipedia.org/wiki/Moore_neighborhood
Can there be an experience that can calculate rough busy and idle times. When we have human density situations where data that is non privacy crowd counting data and infer a set of messaging and interventions.
Take a Waze, Kayak, Google busy index. Add some weather forecasting using some established mathematical models and machine learn some with a set of algorithm based scoring and produce something new that adds value to folks concerned over people density as we return to a new world watching and waiting to recover/

